July 18, 2021
There’s no point in shortening a link if you’re not going to track the performance. That’s the most important reason for shortening it in the first place.
A business must understand the value of each action taken in digital marketing. Most of that starts with attaching links that help track consumer behavior.
 The Linkahwk Analytics Dashboard is a quick tool to help a company better understand the performance of short links, campaigns, and linkboards in the system.
It all starts with a tracking domain…
A tracking domain is the “long domain” owned and controlled by you, for which we will report all click traffic from all Linkhawk users. This is the main URL you start with. Think of it as a home base.
For example, the tracking domain for The New York Times is “nytimes.com”, and the tracking domain for Tech Crunch is “techcrunch.com”.
All click traffic on your tracking domain, including clicks on links that were created by other Linkhawk users, will appear in your Analytics Dashboard.
Keep in mind that a tracking domain cannot be the same as your custom short domain.
You must have FTP access (File Transfer Protocol) to your tracking domain. Some sites, for example, WordPress, allow you to purchase a domain but they do not give FTP access to users.
So it’s important to have a tracking domain with FTP access before you being with analytics.
Linkhawk’s Analytics Dashboard gives you a high-level overview of your top links and activity.
You can set a date range, export data, and drill down to specific details as you navigate the page.
All of the following metrics are displayed for the group you’ve selected in the upper right corner of the page:
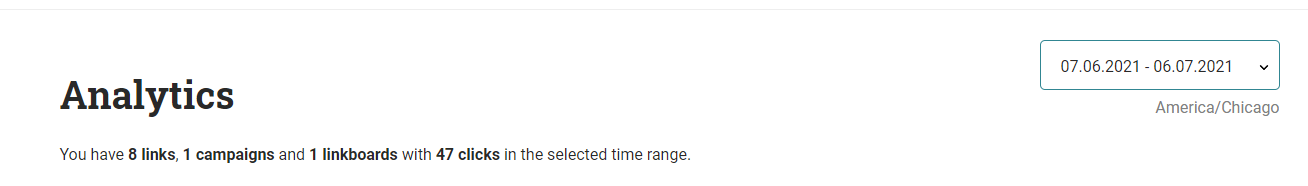
A calendar to enter a date range for focused metrics.
Total amount across all links, campaigns, and linkboards for the date range selected.
A breakdown of clicks by day across your short links, campaigns, and linkboards.
 Clicks by Time
A breakdown of clicks by the time of day across your short links, campaigns, and linkboards.
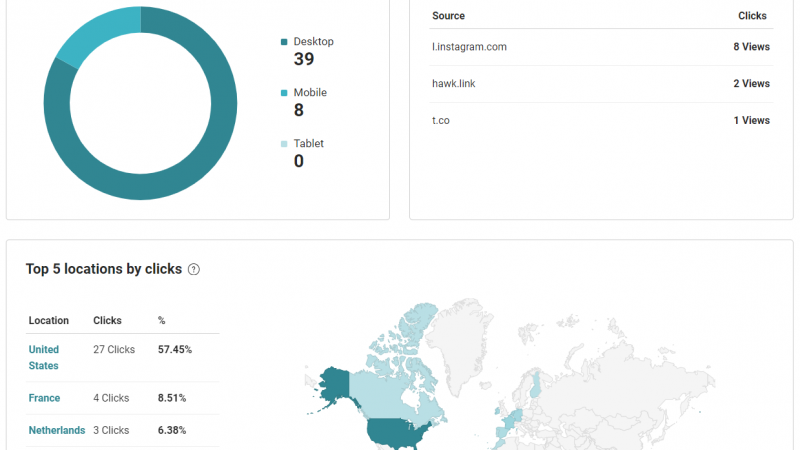
A list of the top devices used by your audience to view your clicks.
Where are people clicking links? This includes channels like social media, your website, ecommerce, and more.
Where do people live/work/play where they are clicking your links? It can be anywhere in the world where users are connecting with your short links. This metric also helps to refine local marketing campaigns.
Which short links are performing the best? What is getting clicked the most?
Which campaigns are performing the best? What is getting clicked the most?
Which linkboards are performing the best? What is getting clicked the most?
 Why Track Links?
Monitoring your short links is about measuring success. You don’t want to keep running campaigns that are dead in the water. If a short link or linkboard is underperforming, it’s time to head back to the drawing board.
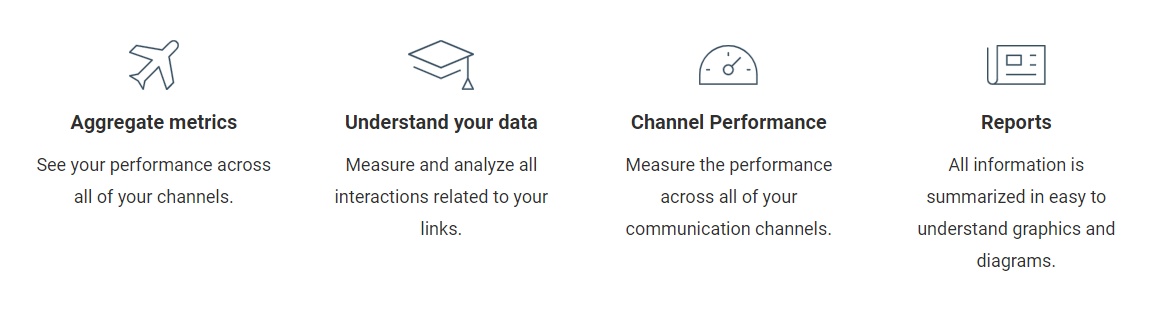
The metrics on the Linkhawk Analytics Dashboard will help you determine who is viewing your stuff, from where, and when. It answers all the “W” questions needed for greater insight and more focused business strategies.
Have any questions on setting up your tracking domain or managing the Analytics Dashboard? Feel free to contact us.
Share this article